


October 2023's Scary Bay Area Real Estate Market Report Wasn't So Scary
- Sunil Sethi
- Nov 8, 2023
- 3 min read
Updated: Nov 15, 2023
I going to compare how the following cities fared over the last 12 months.
Fremont
Union City
Newark
Pleasanton
Dublin
San Ramon
Hayward
Antioch
October's Real Estate Reports by City
Tri-Cities (Fremont, Newark & Union City)
Fremont is the most expensive of these three cities, on average about $300,000 more expensive than Newark or Union City. Union City normally has an average selling price higher than Newark but because of the small number of homes sold in October, and a greater proportion of those with lower sale prices, it's average sale price dropped precipitously. Newark's 12 month appreciation came in at a whopping 34%, Fremont at 19% and Union City was down 12.8%.
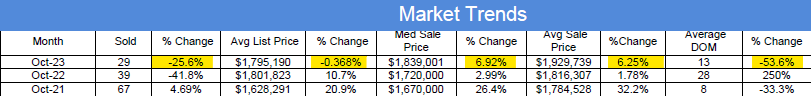
Fremont

Units sold in October are down because inventory is down (from 100 units to 48 active), list prices are down, median sold and average sold prices are up and days on market are down 48.1%. The drop in list price may be explained by more lower priced homes on the market.
Newark

Units sold in October are down because inventory is down (from 34 units to 11 active), list prices are up, median sold and average sold prices are up and days on market are down 71.4%. Newark's statistics look the best. It has the highest increase in median and average sale prices and the lowest days on the market.
Union City

Units sold in October are down because inventory is down (from 25 units to 9 active), list prices are up, median sold and average sold prices are down and days on market are down 42.3%. Weirdly, Union City is the only city where Median and Average sale prices are down. Something is off on these stats. Union City has traditionally fared better than Newark, and the divergence between the two cities is bizarre.
Tri-Valley Cities (Pleasanton, San Ramon & Dublin)
Pleasanton continues to be the most expensive of these three communities with an average sales price of $2,066,605, but it is Dublin that's had the greatest appreciation at 12.1%, Pleasanton at 9.66% and San Ramon at 6.25% for the last 12 months.
Pleasanton

Units sold in October are down because inventory is down (from 58 units to 39 active), list prices are down, median sold and average sold prices are up and days on market are down 50%.
San Ramon
Units sold in October are down because inventory is down (from 39 units to 24 active), list prices are up, median sold and average sold prices are up and days on market are down 54%.
Dublin

Units sold in October are down because inventory is down (from 37 units to 16 active), list prices are up, median sold and average sold prices are up and days on market are down 61%.
Hayward
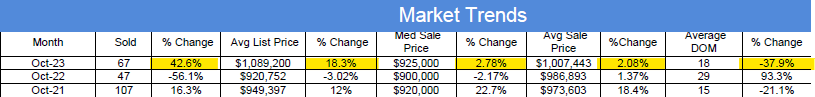
Units sold in October are up 42.6% but inventory is down (from 128 units to 60 active), list prices are up, median sold and average sold prices are up and days on market are down 37.9%. Hayward is the big outlier in units sold, no of the other cities had such an increase in sale and they still had a 50% reduction in units for sale.
Antioch

Units sold in October are up a little but inventory is down (from 241 units to 95 active), list prices are down, median sold price is up and average sold prices are down and days on market are down 39%. Antioch looks to have the weakest market statistics of these 8 cities.
Conclusion
The biggest winner for the Bay Area Real Estate Market Report October 2023 judged by appreciation was Newark 34%, Fremont 19% and then Dublin 17.3%. Union City looked like it had a statistical outlier month. Looking at the data this way, it appears that the Tri-Cities areas fared better in appreciation than the Tri-Valley area. I included Hayward and Antioch because I wanted to see how these two lower average selling price areas had fared against the Tri-city and Tri-Valley areas.
If you've been scared to sell because you think pricing is falling off a cliff, it's not! If you want the money to do something else, now is as good a time to sell! Call me if you want to discuss your next move.
Charts courtesy of BayEast.org


Comments